
Receiving a solar proposal is exciting, but we know it can also feel a little overwhelming.
There are often several pages of figures, graphs, percentages and technical terms, and if you have not looked at a solar proposal before, it is not always obvious which numbers matter most.
The good news is that you do not need to understand every calculation to get a clear picture of how your proposed system is expected to perform.
In this guide, we explain the main sections of your Sunlit Solar proposal in plain English, including what the figures mean, how your expected savings are calculated and why you may see slightly different results in different parts of your proposal.
Start with the basics: your system size
One of the first figures you will usually see is the size of your solar PV system, shown in kWp.
For example, a system might be listed as:
4.55 kWp
This simply means the combined maximum output of all the solar panels under ideal test conditions.
If you had 10 panels rated at 455W each, the total installed capacity would be 4.55 kWp.
It is useful for comparing the overall size of different systems, but it is not the same as saying your system will constantly generate 4.55 kW. Solar generation changes throughout the day and across the seasons depending on sunlight, roof direction, shading and other factors.
What does annual generation mean?

Your proposal will include an estimate of how much electricity your solar panels are expected to generate over a year.
This is normally shown in kWh, or kilowatt-hours.
For example:
Estimated annual output (generation): 6,190 kWh
This is one of the most useful figures in your proposal because it gives you an idea of the amount of electricity the system could produce over a typical year.
Your estimated annual output takes into account factors such as:
- The number and output of the panels
- The direction your roof faces
- The angle of the roof
- Your location
- Expected shading
- The overall size of the system
It is important to remember that this is an estimate rather than a guarantee. Weather conditions vary from year to year, so actual generation will naturally be higher in some years and lower in others.
kW and kWh: what is the difference?
These two terms look very similar, but they mean different things.
kW, or kilowatts, describes power at a particular moment.
kWh, or kilowatt-hours, describes the amount of electricity generated or used over a period of time.
On your electricity bill, the energy you use is measured in kilowatt-hours (kWh). One kWh is the same as one unit of electricity on your bill.
A simple way to think about the difference is to imagine a microwave.
If you had a 1 kW microwave and ran it continuously for one hour, it would use 1 kWh of electricity.
So, the kW tells you how powerful the microwave is, while the kWh tells you how much electricity it has used over time.
When you see the size of your solar system, you will normally see kWp, or kilowatt peak. This is the system’s rated maximum output under standard test conditions. Estimated annual generation will normally be shown in kWh.
How much of the solar energy will I actually use?

Your solar panels will often generate electricity at different times from when your home uses the most electricity.
For example, your panels may produce plenty of energy during the middle of the day, while your highest electricity use may be in the morning and evening.
Your proposal therefore looks at two important figures:
Self-consumption
This is the proportion of your solar generation that you are expected to use directly in your home.
If your proposal says that self-consumption is 56%, for example, it means around 56% of the electricity generated by your panels is expected to be used by your home at the time it is produced.
Export to the grid
Any solar energy you produce but do not use can normally be exported back to the electricity grid.
If your proposal shows 44% export, this means approximately 44% of the electricity generated is expected to be sent back to the grid.
Depending on your energy supplier and tariff, you may be paid for this exported electricity through an export tariff such as the Smart Export Guarantee.
What does ‘energy from solar’ mean?
You may also see a percentage labelled Energy from Solar.
This compares your estimated annual solar generation with your annual electricity consumption.
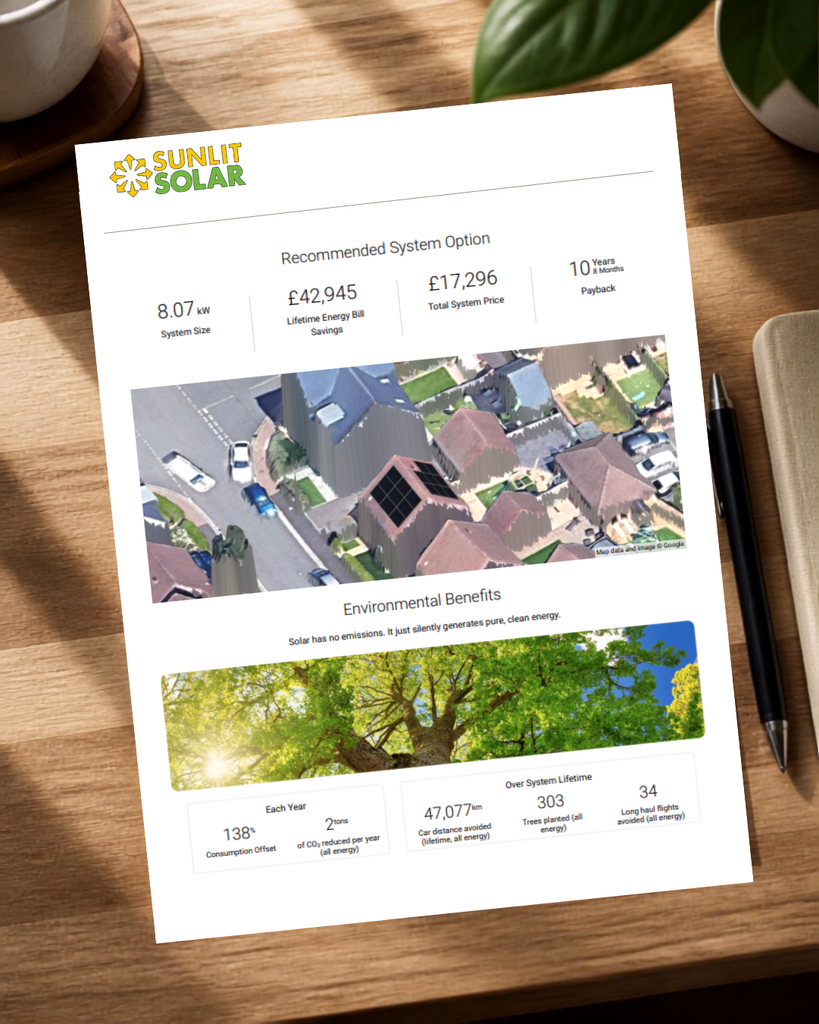
For example, if your home uses 3,500 kWh of electricity each year and your proposed system is expected to generate 4,830 kWh, the proposal may show that the system generates 138% of your annual electricity use.
This does not mean you will be completely independent from the grid.
The reason is timing.
Your solar panels may generate more electricity than you use over the course of a whole year, but some of that electricity will be produced when you are not using it. You may still need to import electricity from the grid at night or during periods of low solar generation.
This is where self-consumption and battery storage become important.
What does grid independence or self-sufficiency mean?

This figure looks at how much of your overall electricity use could be supplied by your solar system.
For example, if your proposal shows 38.3% grid independence, it means the system is expected to cover approximately 38.3% of your total electricity demand directly, reducing the amount of electricity you need to buy from the grid.
This percentage can often be increased by changing when you use electricity or by adding battery storage.
What difference does a battery make?
A battery allows you to store some of the solar energy that you are not using immediately.
Instead of exporting all your excess generation to the grid during the day, you can store some of it and use it later, for example in the evening.
This can help:
- Increase the amount of your own solar energy you use
- Reduce the amount of electricity you need to import from the grid
- Give you greater flexibility over when you use stored energy
- Make better use of suitable time-of-use electricity tariffs
Some battery systems can also provide backup power during a power cut, although this depends on the type of battery and how the system is configured.
Understanding your estimated bill savings

Your proposal may show your current estimated electricity bill alongside your expected bill after solar is installed.
For example, it may compare:
Current monthly bill: £103
with
Estimated monthly bill with solar: £12
These figures are designed to show the potential impact of generating some of your own electricity.
Your total financial benefit may come from two areas:
- Buying less electricity from the grid
- Receiving payments for electricity exported to the grid
The proposal will usually combine these figures when estimating your overall savings.
What are lifetime bill savings?
You may see a figure for Lifetime Electricity Bill Savings.
This is an estimate of how much you could save over the expected lifetime of the system compared with continuing to buy all of your electricity from the grid.
It is based on a number of assumptions, including future electricity prices, solar generation and export payments.
Because nobody can predict future energy prices exactly, these figures should be viewed as a useful projection rather than a guaranteed return.
What is the payback period?

The payback period is the estimated amount of time it could take for your accumulated energy savings to equal the original cost of the solar installation.
For example, if your system costs £17,296 and the estimated payback period is 10 years 8 months, the model suggests that by around year 10.5, your total savings could have matched the initial investment.
After that point, the system continues to generate electricity and potential savings.
Again, the exact payback period will depend on factors such as future electricity prices, your actual energy use and how much of your solar generation you use yourself.
What do ROI, IRR and NPV mean?

Some proposals include more detailed financial figures. These can look complicated, but you do not need to be a financial expert to understand the general idea.
Return on Investment (ROI)
ROI gives an indication of the financial return from the system compared with the amount initially invested.
In the example above, the total return on investment is estimated at 306%. This means the projected financial benefit over the lifetime of the system is just over three times the initial investment.
Internal Rate of Return (IRR)
IRR is another way of measuring the projected financial performance of the investment over time.
In this example, the IRR is 16%. This can be useful when comparing the projected return from solar with other ways you might use or invest your money.
Net Present Value (NPV)
NPV looks at the value of the projected future savings in today’s money. This takes into account the fact that money saved in the future is not necessarily worth the same as money today.
In this example, the NPV is £19,059. In simple terms, after taking this into account, the system is projected to provide £19,059 of additional financial value over and above its cost.
These figures are different ways of helping you understand the potential long-term financial value of the system.
If you would rather focus on the practical figures, the estimated annual generation, bill savings, grid independence and payback period are usually the easiest places to start.
What are optimisers?
If you have been proposed a SolarEdge system, you may see power optimisers listed in your proposal.
These are fitted to the solar panels and allow each panel to operate more independently.
This can be particularly useful where panels are installed on different roof areas or where some panels may experience shading at different times of the day.
Your SolarEdge estimate takes these optimisers into account when modelling system performance, whereas some standard calculation methods do not account for their effect in the same way.
Why do the graphs change throughout the year?

Your proposal may include monthly or daily energy graphs showing solar production and household consumption.
These are designed to illustrate the natural seasonal pattern of solar generation.
In summer, your panels are expected to generate considerably more electricity because the days are longer and there is generally more available sunlight.
In winter, generation is lower and you are likely to rely more heavily on electricity imported from the grid.
This seasonal variation is completely normal and is already taken into account when calculating your estimated annual generation.
The most useful figures to focus on
There is a lot of information in a solar proposal, but you do not need to study every number.
If you want a quick overview of your proposed system, we recommend looking at these five figures first:
- System size
How large your proposed solar array is. - Estimated annual generation
How much electricity the system is expected to generate each year. - Self-consumption and grid independence
How much of your solar energy you are likely to use and how much less electricity you may need to buy from the grid. - Estimated bill savings
The potential financial benefit of generating and using your own electricity. - Payback period
An estimate of how long it may take for the savings to equal the initial system cost.
Together, these give you a good overall picture of how your proposed system is expected to perform.
Your proposal is designed around your property
Every property and household is different.
Roof size, orientation, shading, electricity use and future plans can all affect what makes the most sense for you.
That is why our local, family-run Somerset team designs systems around the property and customer’s needs rather than offering off-the-shelf packages.
We will always be happy to talk you through your proposal, explain any figures you are unsure about and answer questions before you make a decision.
Our aim is to make sure you understand not only what equipment has been proposed, but why we believe it is the right design for your home.
If anything in your proposal is unclear, please email the Sunlit Solar team. Email is the best way to get in touch with us and means we can make sure your question reaches the right person in the team. We’ll be very happy to help.
Email: info@sunlit-solar.co.uk
Website: www.sunlit-solar.co.uk
